eDNA monitoring and conservation genomics of the Pilbara Olive Python
eDGES v1 – Project 1
This project aims to merge environmental DNA (eDNA) monitoring with genomic analyses to study the Pilbara Olive Python (Liasis olivaceus barroni) – an endangered Australian terrestrial top predator. In this project we have developed new genetic assays to detect Pilbara Olive Python eDNA, and assembled a complete reference genome for the Pilbara Olive Python. Next steps include assessing the decay rate of Pilbara Olive Python DNA in the environment and establishing a novel molecular monitoring framework to integrate eDNA with whole-genome sequencing.
This project aims to develop new and important tools to facilitate the monitoring and evaluation of conservation priorities, practices, and policies for the Pilbara Olive Python.
Highlighted outputs and outcomes:
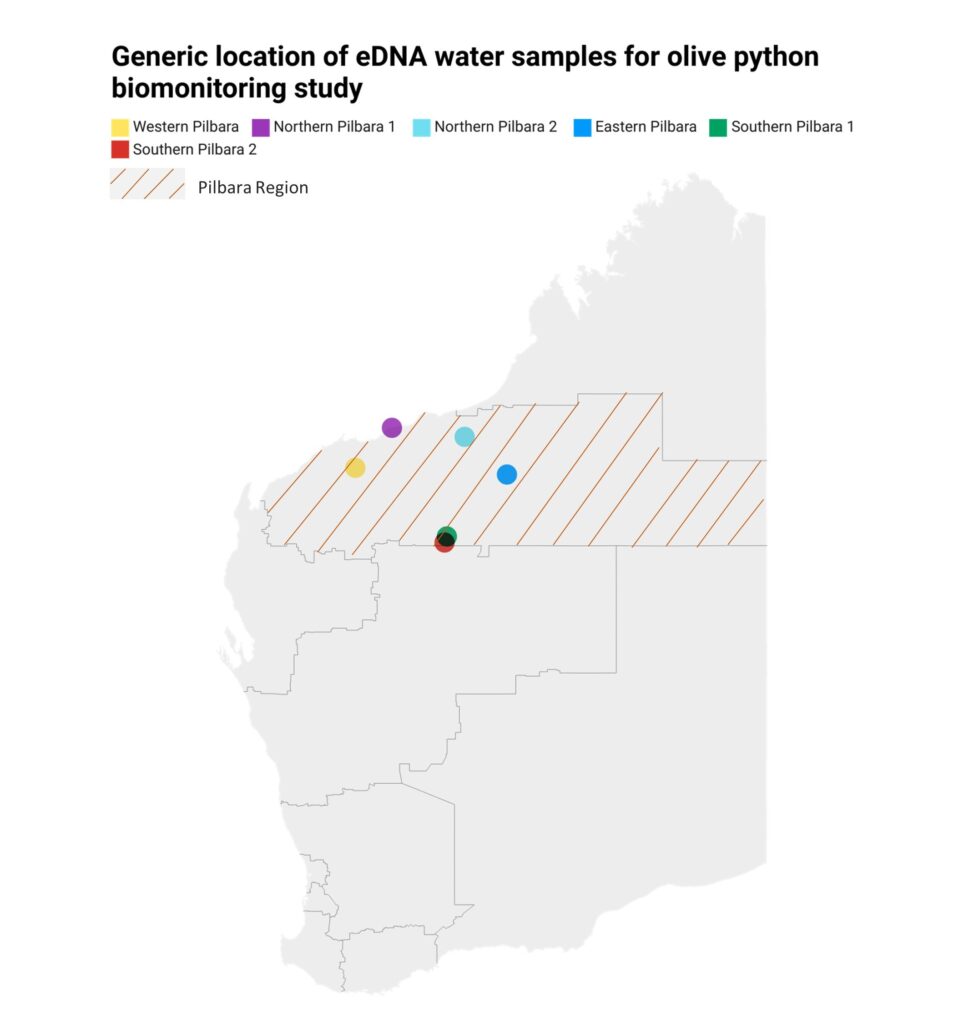
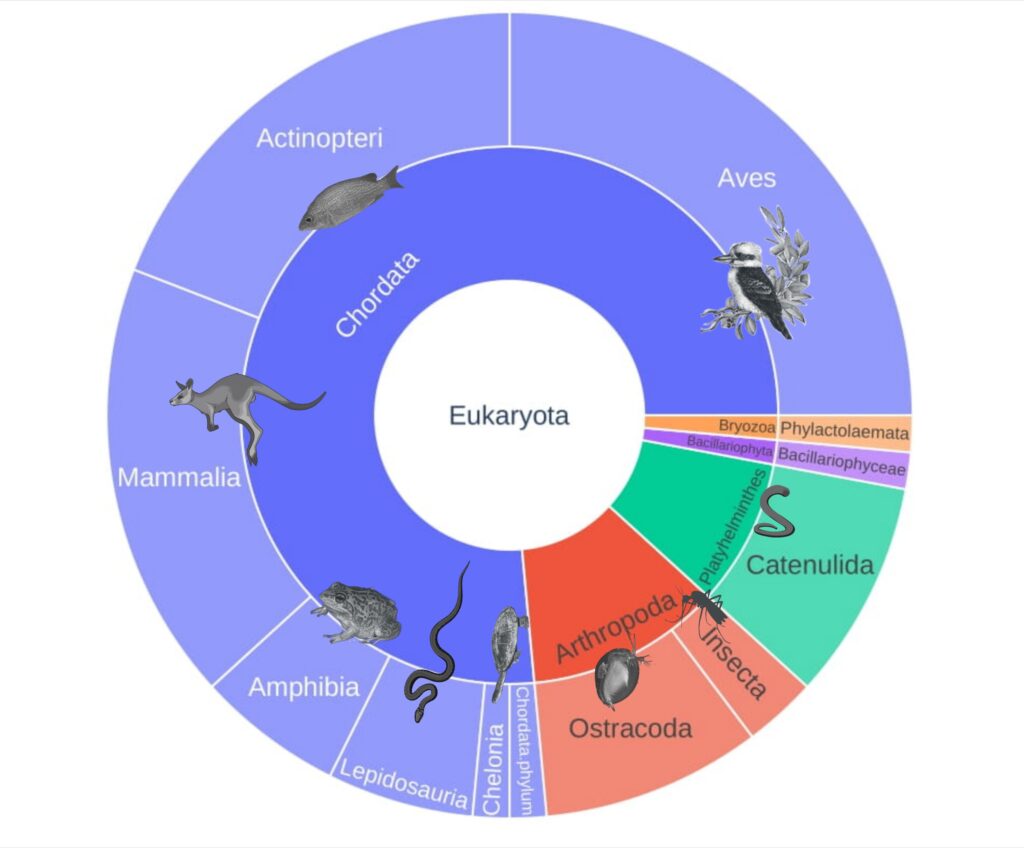
We show that water in rock pools is an excellent substrate for olive python eDNA monitoring (published as Mousavi-Derazmahalleh et al. (2023) “Rock pools as a source of environmental DNA for the detection of the threatened Pilbara olive python Liasis olivaceus barroni”, Frontiers in Environmental Research – Figure 1 below).
Figure 1: Results from Mousavi-Derazmahalleh et al. (2023) showing regions where eDNA water samples were collected (left) and the overall diversity found in the samples (right).
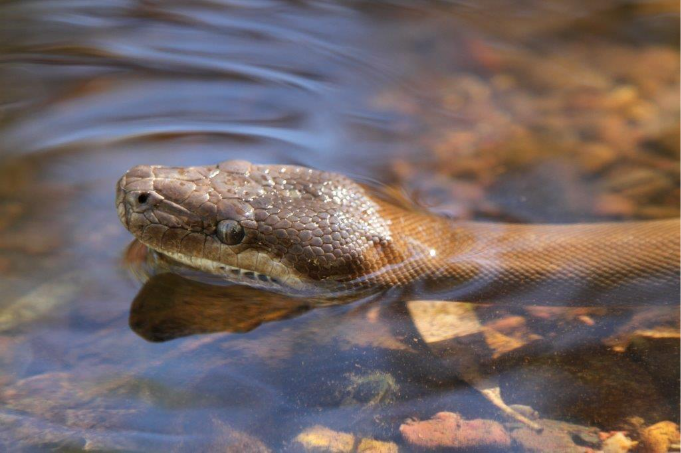
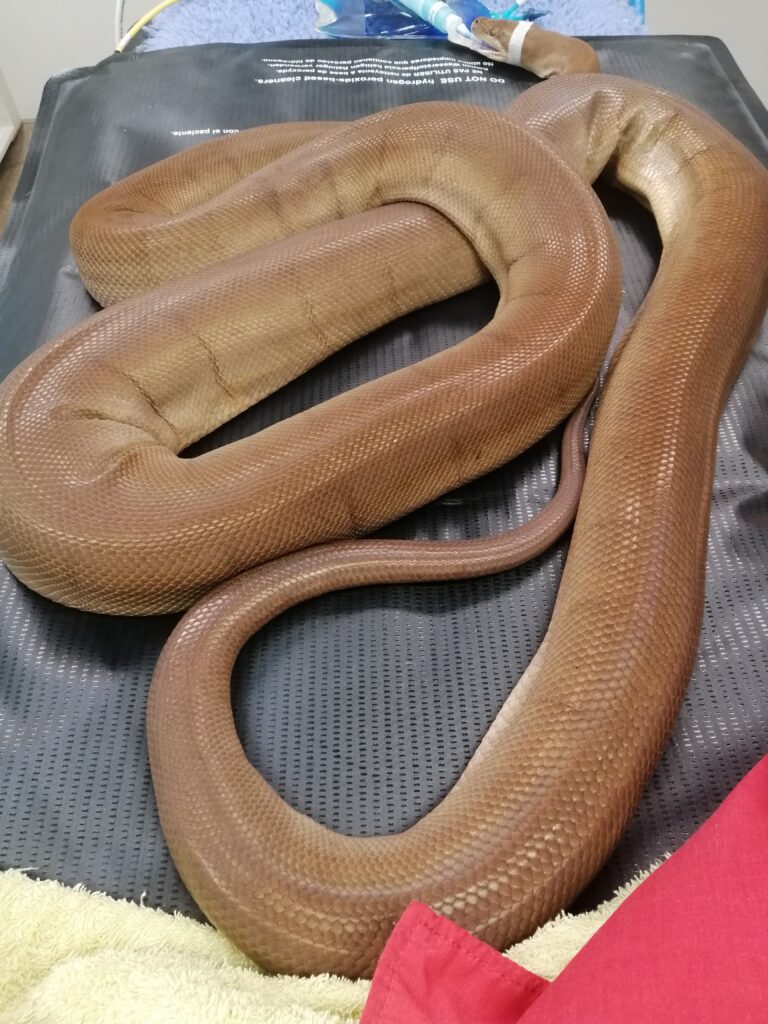
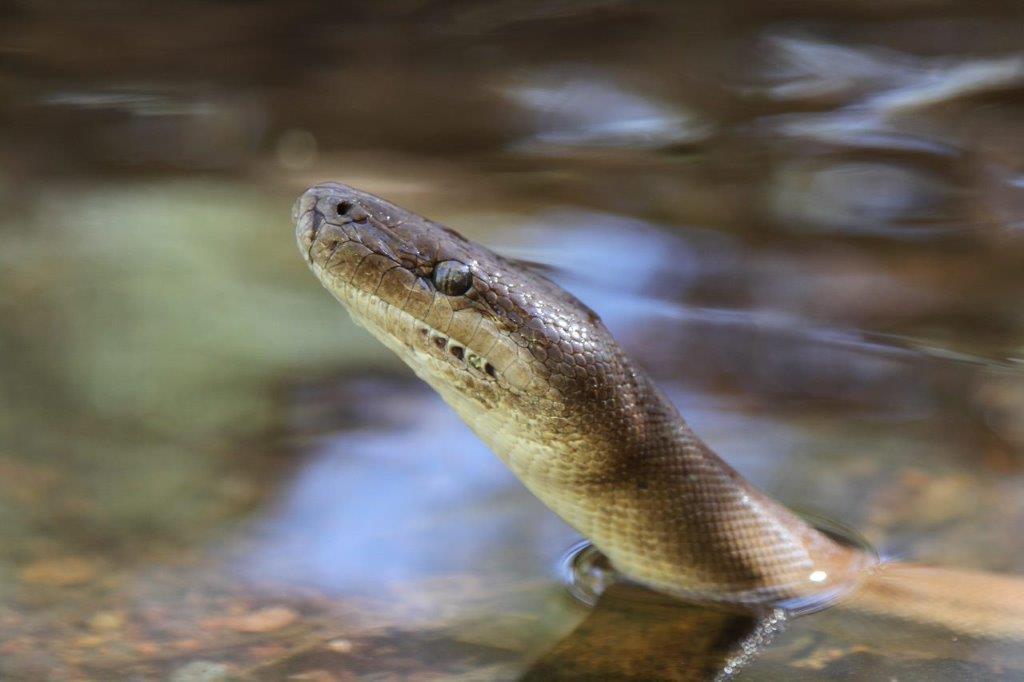
Figure 2: A Pilbara Olive Python in a rock pool. Credit R. J. Ellis.
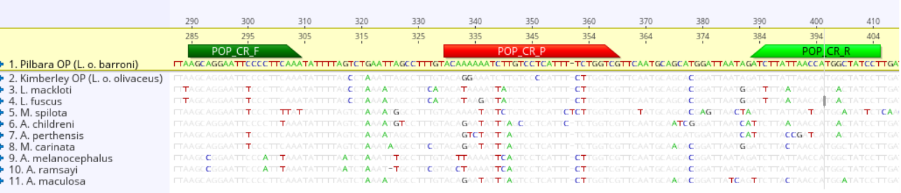
Development of a high-sensitivity species-specific qPCR assay for olive pythons, now published in Environmental DNA.(Dawkins, K. L., Heyward, B. L., Mousavi‐Derazmahalleh, M., White, N. E., & Allentoft, M. E. (2025). A qPCR Assay for the Threatened Pilbara Olive Python (Liasis olivaceus barroni). Environmental DNA, 7(4), e70114. https://doi.org/10.1002/edn3.70114.
Figure 3: The region of interest used for the qPCR assay, with the Pilbara olive python DNA in yellow and discrepancies to other species of python highlighted.
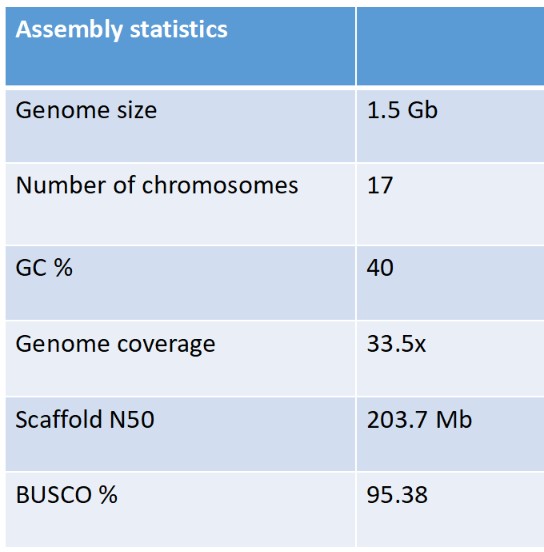
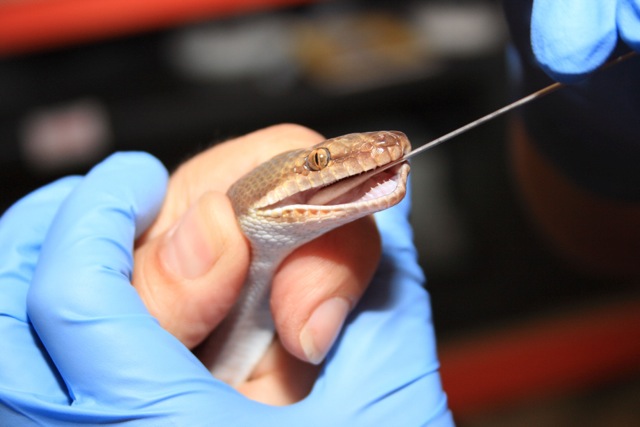
Sequencing and assembling the first complete genome of the Pilbara olive python in collaboration with the Vertebrate Genome Project, (VGP). The quality of the genome is exceptional with assemblies into full chromosomes and an N50 value of 203.7 Mb (see table below). The assembly of the Kimberley Olive python (Liasis olivaceus olivaceus) genome is in final stages.
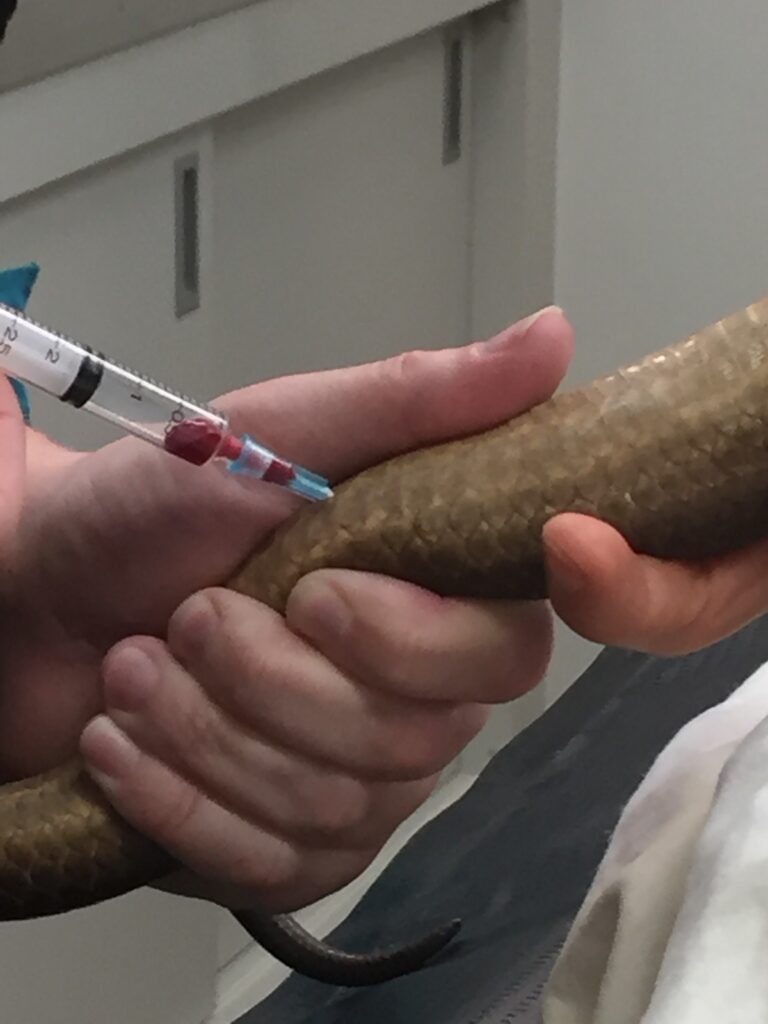
Figure 4: Blood sampling of a Pilbara Olive Python at Perth Zoo. A high-quality reference genome of Pilbara Olive python was built from sequencing and bioinformatic assembly of this blood sample.
Table 1:Assembly statistics of the Pilbara Olive Python genome.
Substrates from Perth Zoo and Caversham Wildlife Park olive python enclosures were sampled and have now undergone species-specific (Figure 6) and community composition (Figure 7) analyses. These results highlight key points for future sampling.
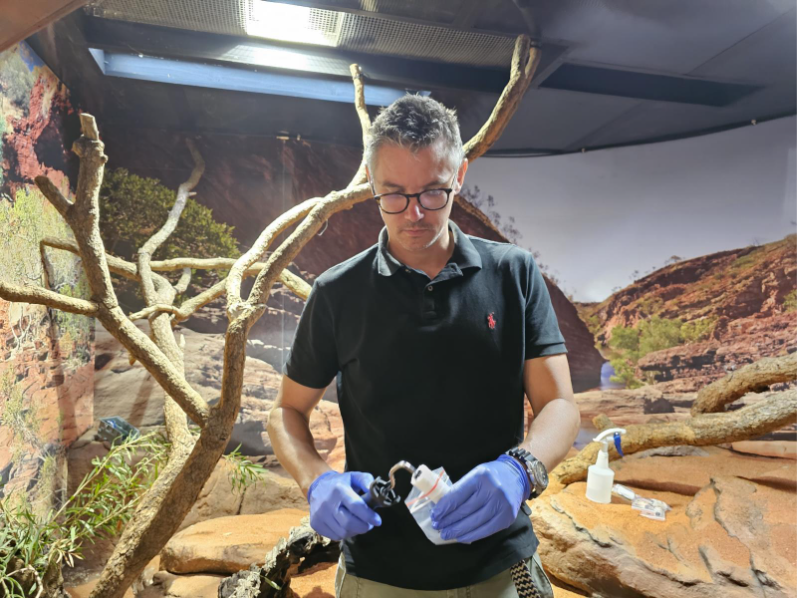
Figure 5:Morten Allentoft taking a surface sample in the Perth Zoo olive python enclosure.
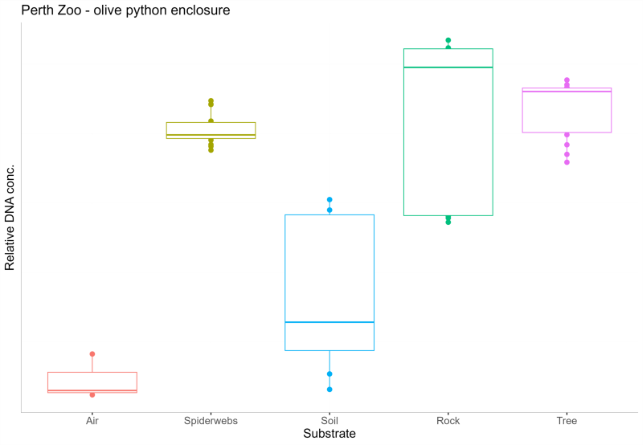
Figure 6:qPCR results showing relative DNA concentration in five substrates (Air, Spiderwebs, Soil, Rock surfaces, and Tree surfaces) taken from the olive python enclosure at Perth Zoo.
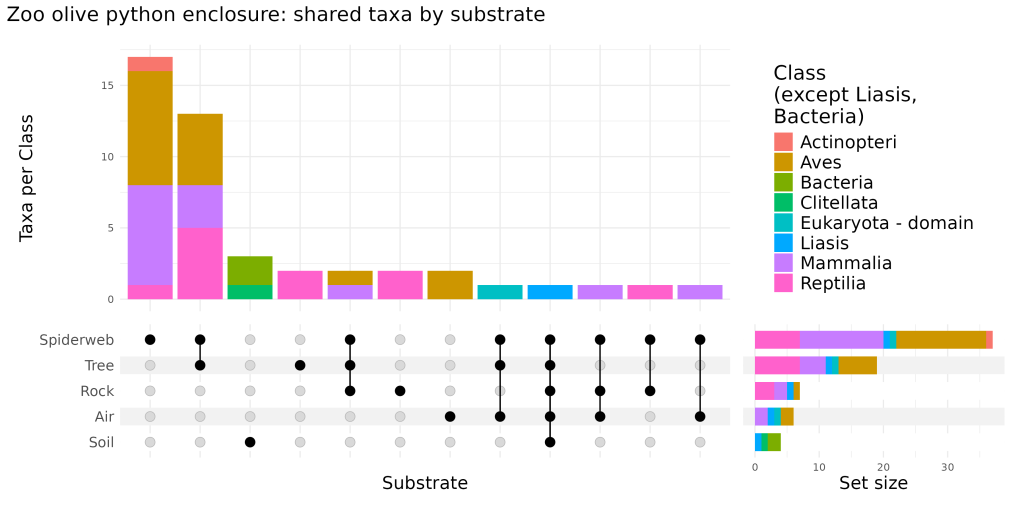
Figure 7: Biodiversity detected through metabarcoding of the Perth Zoo olive python enclosure. Numbers on the y-axis indicate the unique taxa detected across substrate types (x-axis). Taxa are at the ‘Class’ rank, except for the genus of interest Liasis (olive python).
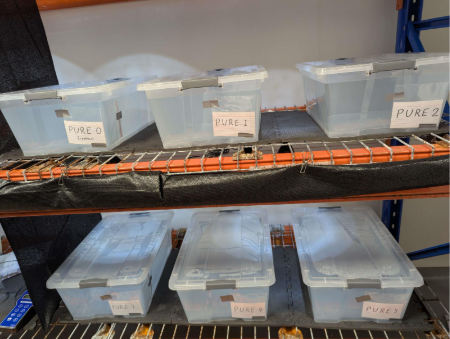
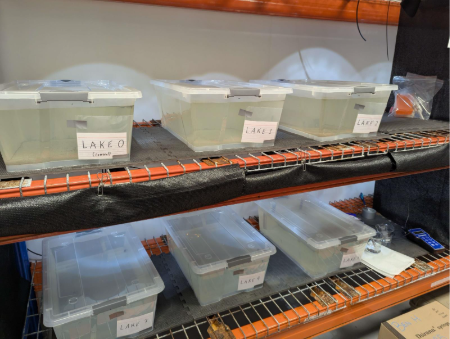
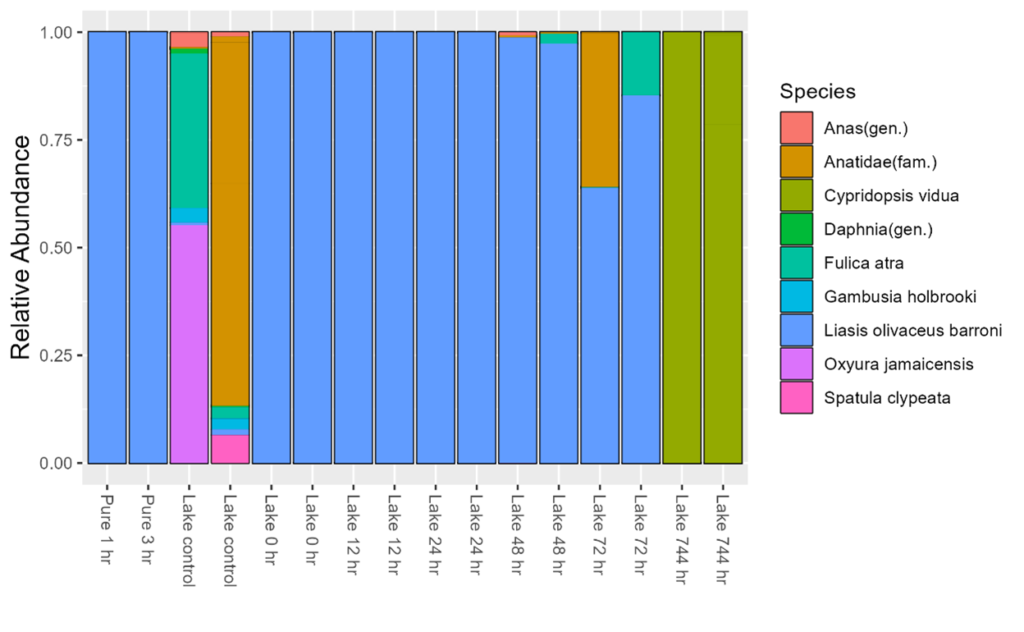
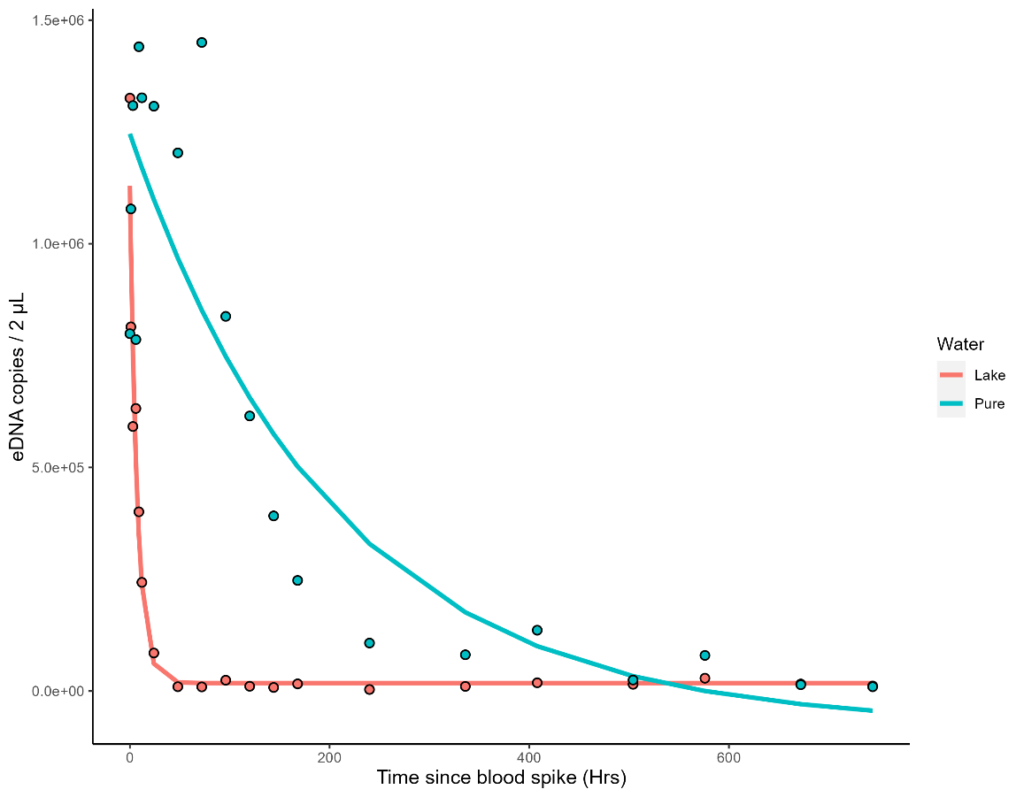
All samples from a tank experimentassessing the decay of Pilbara olive python eDNA in natural and pure water (Figure 8) have been taken and are currently being processed. This experiment will assist in determiningthe feasibility of obtaining genome-wide data from eDNA. This experiment is a more robust version of what was conducted during Ben’s honours project (Figure 9).
Figure 8:Tank experiments on the decay of Pilbara Olive Python eDNA over time in natural water.
Figure 9:Results from the Honours tank experiment (left) eDNA copy number/2 μL (y-axis) against exponential decay models fit to both tanks (orange = lake; blue = pure) over 1 month (x-axis). (right) Metabarcoding results of selected samples (2 pure tank samples, 2 lake tank control replicates, and 6 lake tank time points in duplicate). Relative abundance is displayed on the y-axis. Any taxa that could not be assigned to species level is shown as the lowest common ancestor.