Measuring abundance with eDNA
eDGES v2 – Project 8
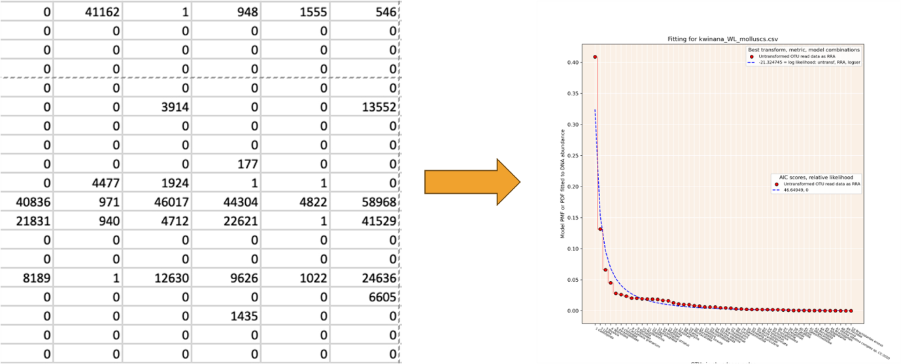
This project focuses on building models of species abundance from eDNA metabarcoding datasets. Well-established species abundance distributions such as the lognormal distribution can be fitted to data in metabarcoding datasets. The underlying species abundance distribution will provide a better estimate of the relative abundance of species in the environment than the raw eDNA data.
The use of these models for species abundance has several applications in ecology. The most obvious is just to generate better estimates of relative biomass of species in any environment. Another is to improve our understanding of how similar communities are. In the example below, 75 eDNA samples were taken at two adjacent locations in Shark Bay on the West Australian coast and fish species were identified from one metabarcoding assay. This area is characterised by a strong salinity gradient from hypersaline water in Hamelin Pool to normal seawater in the Eastern Gulf. We analysed the fish communities in both locations. If we accept all detections, then the communities look quite similar. However, if we start to filter our results by abundance based on a model, the more we filter the data to higher abundance species, the more dissimilar the fish communities become. If we only consider species present at >1% total abundance they are very dissimilar communities, which is what would be expected for such different salinity conditions. This emphasises the importance of abundance in community comparisons, and suggest that many eDNA community comparison results based on incidence alone are misleading.
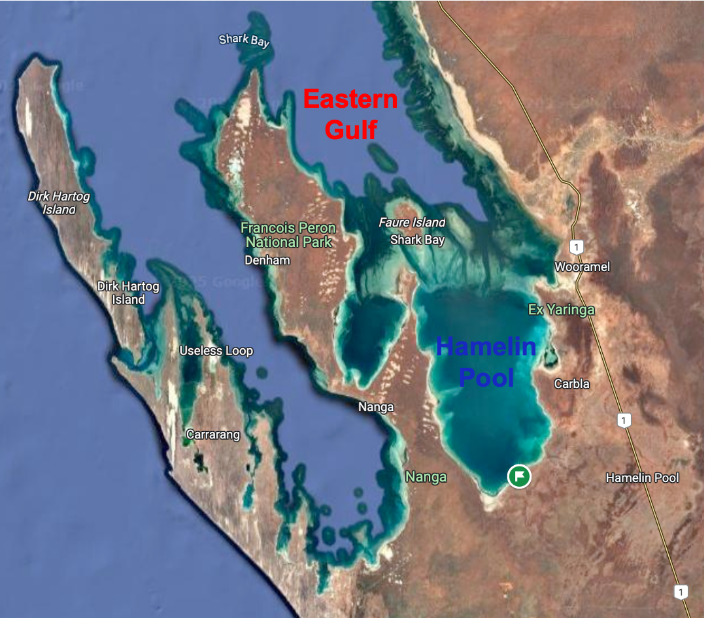
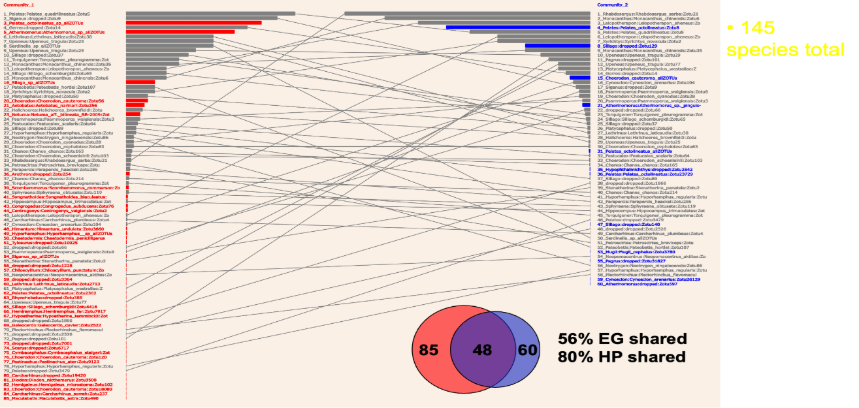
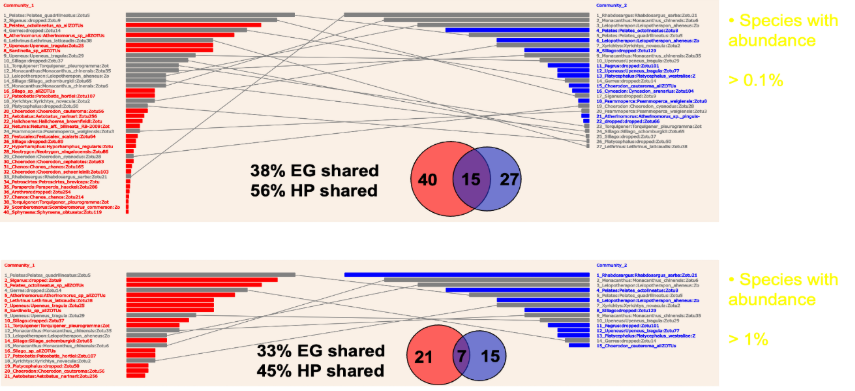
Figure 1: The importance of abundance measurement in eDNA metabarcoding. Two communities of fish in adjacent parts of Shark Bay were studied by highly-replicated eDNA sampling. Abundance based on SADs is shown as horizontal bars. Fish unique to their own community are shown as red or blue. Fish present in both communities are grey. If this is analysed with only presence/absence, as given by Venn diagrams, the communities have extensive overlap as raw data. This is because the actual change between communities is in abundance, from high to low, or vice versa. eDNA metabarcoding is very sensitive, and a small quantity of DNA is treated in the same way as a large amount, which is misleading. If the data is filtered to the most abundant species, the communities look far more differentiated, which is a more accurate description of community differences. This is one application of the software developed in this project, but there are many more.
The analyses above use a software package “SQEMA” that was written as part of this project. It is freely available and is described in the software section of this website.